|
Historical informatics
Reference:
Valetov T.
Teaching the basics of historical geography and geographic information systems at the Department of Historical Information Sciences (Faculty of History, Moscow State University)
// Historical informatics.
2024. ą 1.
P. 108-122.
DOI: 10.7256/2585-7797.2024.1.70218 EDN: OJJUMS URL: https://en.nbpublish.com/library_read_article.php?id=70218
Teaching the basics of historical geography and geographic information systems at the Department of Historical Information Sciences (Faculty of History, Moscow State University)
Valetov Timur
ORCID: 0000-0002-1981-6144
PhD in History
Senior lecturer, Lomonosov Moscow State University
119192, Russia, Moscow, Lomonosovskii pr-t, 27-4, Faculty of History, G-423

|
valetov@gmail.com
|
|
 |
Other publications by this author
|
|
|
DOI: 10.7256/2585-7797.2024.1.70218
EDN: OJJUMS
Received:
24-03-2024
Published:
11-04-2024
Abstract:
The article describes the experience of teaching the course “Historical Geography and Geographic Information Systems” within the framework of the specialization “Historical Informatics” at the Department of Historical Informatic Science, Faculty of History, Moscow State University. We teach this discipline to third-year undergraduate students. The course includes several thematic blocks. The first one is devoted to Russian historical geography, and the main difficulty is to fit this voluminous course into several lessons and leave time for the remaining blocks. The second block is the basics of cartography, the history of cartography in Russia (that is, source studies of historical maps), and here we can also speak about electronic libraries of raster and vector historical maps of Russia. The third block is devoted to the substantive basics of spatial visualization. This block seems to be the most important: learning to use the proper software is an important, but it is the least constructive part of the research. It is more important to understand how to set tasks correctly and what complexities are typical to this type of visualization. Within this third block we examine both entertainment projects and research articles using historical maps. The last block of issues studied within the framework of the course is the basics of GIS software studying. We study QGIS here: it is officially freeware, cross-platform, it uses the wide-spread shapefile format, and it is well compatible with open Internet services, such as OpenStreetMap and the Google maps. Students learn to draw shapefiles upon raster maps, to attach data from spreadsheets to their vector maps and to create thematic maps, to transform the projections. We hope that our methodological experience will be useful to teachers.
Keywords:
historical GIS, university teaching, spatial visualization, historical cartography, online map services, historical data science, digital history, Russian history, geography, QGIS
This article is automatically translated.
You can find original text of the article here.
* * * Teaching the basics of GIS at the Faculty of History of Moscow State University began in 2009, but the article will focus only on teaching the course "Historical Geography and GIS" for undergraduate students specializing in Historical Informatics, which the author has been teaching since 2014. The course in question is one of the basic cathedral courses in the profile "Historical Informatics" and is taught in the third year to undergraduate students. In accordance with the approved program, 32 hours of classroom classes are allocated for the course, and reporting is a differentiated credit. The purpose of this article is to share the experience of developing this course and talk about its methodological content. The course assumes that some students may choose to work with GIS as a methodological basis for graduate work, and the Department of Historical Informatics of Moscow State University is mainly focused on topics on national history, while historical geography is not taught separately to students of our specialization, therefore, both the basics of historical geography of Russia and the principles of working with GIS are combined in one course. Unfortunately, in one semester course, within the framework of our schedule, we have to combine several components at once, each of which is worthy of devoting even a whole separate semester course to them, and this is just historical geography, but also the technical part dedicated to working with programs. With that said, the course is thematically divided into four independent blocks: · Historical geography of Russia. · Fundamentals of cartography and the history of cartographic sources on Russian history; issues of accessibility of raster and digital historical maps for the researcher. · Spatial visualization and meaningful problems of using GIS in historical research. · Basics of working with digital maps in application software. In terms of content importance, these four blocks seem to be about the same, and their study takes about the same time within the course, which, in fact, puts the course under fairly strict time conditions. There is no point in specifically talking about the course of historical geography; there are a number of decent textbooks on this discipline [1] [2] [3], although the Soviet period is less affected by the authors, and they also have to resort to scientific literature [4]. The main problem is how to put such a course into several classes. You can't do without independent work here, and you can save time by talking about the details. On the one hand, it is impossible to talk about the historical geography of Russia in the XVIII–XX centuries without voicing quite a lot of factual material (which there is no time for in the lecture mode); on the other hand, all this factual material is, in a certain sense, of a reference nature. The sequence of a huge number of geographical names linked to certain historical dates does not seem to be so important in relation to understanding the processes that took place. So, the history of administrative division is the history of management, and it is important not to list the regions and districts that arose, were canceled and renamed, but to understand the essence of the largest restructuring of the entire system: how were national autonomies organized and existed in the USSR in accordance with the national policy of the Bolsheviks, on what principles was the "Gosplan reform" built, why was it curtailed, etc. The same is true with the history of transport: it is not necessary to remember all the channels and sections of railways with the dates of their construction, it is all in Wikipedia, but you need to imagine the general stages of development of the transport system, the connection of river basins with administrative regions and seaports, to understand the internal logic of transport development in the context of demographic and economic development of the regions of the country. In order to keep up with two or three classes, all the factual material is sent for independent study, and students, following the results of reading chapters from textbooks on historical geography, write an abstract on one of the following topics: · Administrative-territorial division of Russia before 1917 · Administrative-territorial division of Russia/USSR in the twentieth century. · Problems of historical geography of the population in Russia in the XVIII–XX centuries. · Historical geography of industry and agriculture before the twentieth century. · Communication routes and transport in the XVIII–XX centuries. When the essays are written, the topics are briefly discussed in the classroom. It should be noted that abstracts sometimes come with incorrect borrowings both from the text of textbooks read and from other texts that can be found on the Internet, so you have to carefully check them for plagiarism. Unfortunately, it is impossible to completely avoid such a development of events, because to formulate narrower topics about which there are no ready–made texts on the Internet is to get away from the main task of familiarizing oneself with the basics of historical geography. Students are given three weeks to write an abstract, and while they are reading the material and writing their papers, classes on the history of cartography are held in lecture mode. The issues of projections in modernity and in a historical context, issues of reliability of historical maps are discussed, the history of Russian cartography from the "Big Drawing" of the XVI century to Soviet topographic maps is also told here. The third part of the course is devoted to the essence of spatial visualization. It seems to be the main one in the entire course, because in using GIS it is essential to understand what visualization depends on and what it shows; these answers are not always obvious.
In order to better understand the problems of visualization, first of all, a meaningful analysis of projects available on the Internet, both interactive and made in the form of videos, in which some maps are dynamically changing, is well suited. These projects do not have to be perfect from a substantive point of view. On the contrary, it's even good if some of their flaws are so conspicuous that you can immediately say that you shouldn't do this. Projects can be both full-fledged scientific and very simple amateur ones, they can be devoted to any problem, from the history of boundary changes to demographic and social ones. My experience shows that the main task is to decompose the problems of each of the projects into three meaningful groups, to make you think about each of them: 1. The purpose of the project, the object of the study. What does the author want to show by visual methods, which objects should be displayed on the map, can we say that these objects have a clear meaning and allow correct mapping on the map? 2. Source of maps and information. Does the source allow you to display correctly comparable information on the map? 3. Visual design. This can include any issues of coloring, scale, signatures, overlapping layers, etc. As a rule, this group of problems, as the most obvious, causes the greatest response at first from the one who gets acquainted with the project. However, although it directly affects the perception of the GIS project, and therefore has full importance, it is still not as fundamental as the first two groups. A project that is reasonably based on the right sources, but is ugly in design, can achieve its goals (especially since many elements of visual perception are perceived subjectively, if the visualization is not completely incompetent). But a project cannot become such, even if it is flawlessly designed, in which the internal content is erroneous, and the sources do not correspond to the task at hand. Let's look at one of the examples that are discussed with students in our course: maps of the locations of historical military battles in the world over the past few centuries. Here we are looking at one video (World Battleground, 1000 years of war in 5 minutes. The video clip. URL: https://youtu.be/1hsDn2kNriI ) (very carelessly made in terms of design and clearly not intended for someone to study it) and one interactive project (A Wikidata/DBpedia Geography of Violence. Website. URL: https://battles.nodegoat.net /), much better designed. In the video, battles are depicted by conditional explosions, the size of which is proportional either to the number of fighters or the number of losses, and this in itself hints that the purpose of the video is to show in which epochs and in which regions of the world wars were the most fierce. There is no such visual component in the interactive project (the points of "battles" are accompanied by interactive information about events with hyperlinks to articles in DBpedia), but since the project itself is called "Geography of violence on Wikidata/DBpedia", the same meaning seems to be visible. In any case, the density of battle points also leads to the idea that in different eras the military history of different regions was saturated in different ways. But does such a conclusion follow from the presented visualizations? 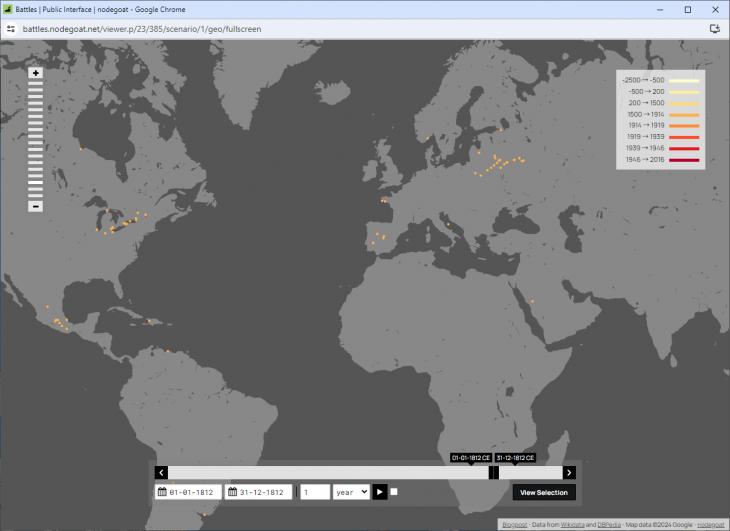
Fig. 1. A sample of points from 1812 in the project "Geography of violence on Wikidata/DBpedia". To begin with, it is difficult to define the visualization object itself. Speaking of a battle, we can imagine a certain field on which the armies of the opponents converge, fight there from morning to evening, after which some result of the battle is formed. Let this, from the Marathon Battle to Borodino, be a classic option. But do all more or less major military clashes fit into this format? What about, for example, the sieges of cities that could last for months, including without particularly active hostilities? What about the constant daily months-long war along the long front line? What about a war or an uprising consisting of a huge number of relatively minor clashes? How well are such events comparable? Next, where is the line after which those "more or less large" battles worthy of being displayed on the map begin? If we turn to the projects under consideration, we will see that their attitude to these issues is superficial (which is most likely determined by the source base used). The composition of the points of the interactive project we are considering for 1812 is quite indicative (Fig. 1): in addition to a number of points on the path of the Napoleonic army, there is also a point in St. Petersburg called "The French Invasion of Russia" and provides a hyperlink to the general article "The Patriotic War of 1812" And at the same time to the south-in the west of Hudson Bay in America there is a point "Pemmican War", which, as far as you can read on Wikipedia, was a series of clashes between companies that collected furs in Canada, and it dates, according to Wikipedia, 1812-1821, and the murders reached only in 1816, and there were several dozen people killed. It should be noted that the approach to the selection of points does not allow us to perceive them as something unified and comparable, so the question of the goals of the project arises in full growth. These goals, we note, are not specifically spelled out. When we turn to the source database of the projects under consideration, we are faced with a new problem: both of them took only what was in the English-language Wikipedia at the time of the creation of the project (actually, most likely, the real purpose of the projects was to parse Wikipedia data with subsequent visualization programming on the map). The obvious features of the source shift the focus of world military history: The Civil War in the United States is illustrated in an interactive project with several hundred dots, the Civil War in Russia with two dozen. The worst thing is that the thousand-year history of wars in reality, of course, consists of an incalculable number of battles, undocumented in the sources known to us, therefore not reflected on maps. In both projects, almost no events have occurred in Central America, Africa, or Siberia for the entire thousand years. The Mongol conquests of the entire first half of the XIII century fit into 17 points. The source is not suitable for illustrating the world history of wars as an ongoing process; most likely, it is impossible to select a source for the task in principle. How should we treat such projects?
Another possible issue for discussion is projects dedicated to the historical change of state borders. There are several YouTube videos on this score at once (for example: a) The History of Europe: Every Year. The video clip. URL: https://youtu.be/oWWLECJnylM b) The History of Europe [2600 BC – 2020 AD] Every year. The video clip. URL: https://youtu.be/P9YnYRk8_kE c) The History of Europe: Every Year (V2). The video clip. URL: https://youtu.be/0TY4UzJCvlI d) The History of the World: Every Year. The video clip. URL: https://youtu.be/-6Wu0Q7x5D0). The maps for them are mainly made for this format, and one of them is based (illegally) on the maps of the Centennia project (The Centennia Historical Atlas. Website. URL: https://historicalatlas.com /). On the very website of the Centennia project, you can buy access to a much more developed interactive project with border changes in Europe over a thousand years and download for free (legally) part of it for 1789-1939. In the same row there is a good online project "GeaCron" (GeaCron: interactive historical atlas of the world since 3000 BC. Site. URL: http://geacron.com /), representing the borders of states over 5,000 years around the world (although even the maximum approximation here leaves the maps very large-scale). It seems useful to evaluate all these projects from the same perspective. What is their purpose, what does the object of study look like? Even today, there are problems in unambiguously drawing all the borders between all countries, and in the Middle Ages it is possible to talk about state borders only with a certain degree of conditionality; moreover, the very concept of states, the borders of which each project shows us, can be difficult to define unambiguously in a historical perspective. In any case, there is a wide variability in these issues, which, we note, all projects are forced to solve somehow, but no project understands (although it would be strange to make such demands to videos on YouTube). Students of history are an excellent audience to discuss this variability and the possibilities of solving it, especially since several different projects show the same thing and provide an opportunity to compare their approaches. 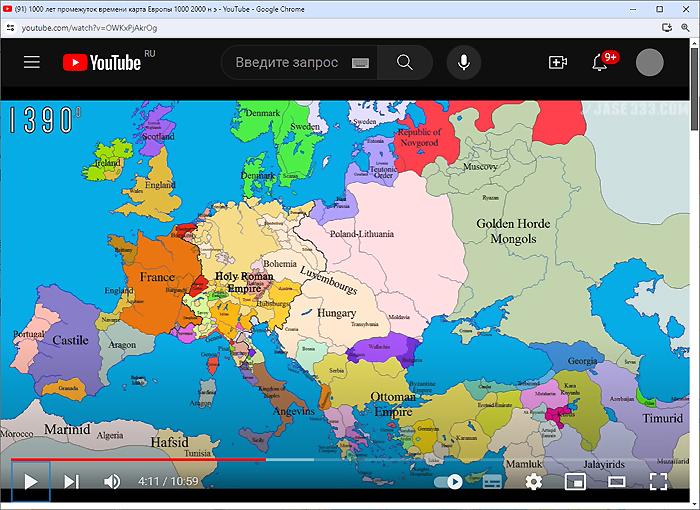
Fig. 2. Map of Europe in 1390 according to various Internet projects: Centennia Historical Atlas. 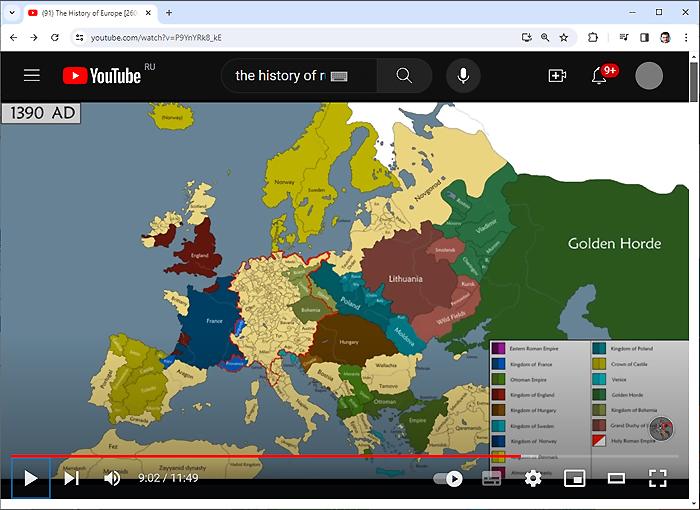
Fig. 3. Map of Europe in 1390 on various Internet projects: Video clip of the Balkan History channel. 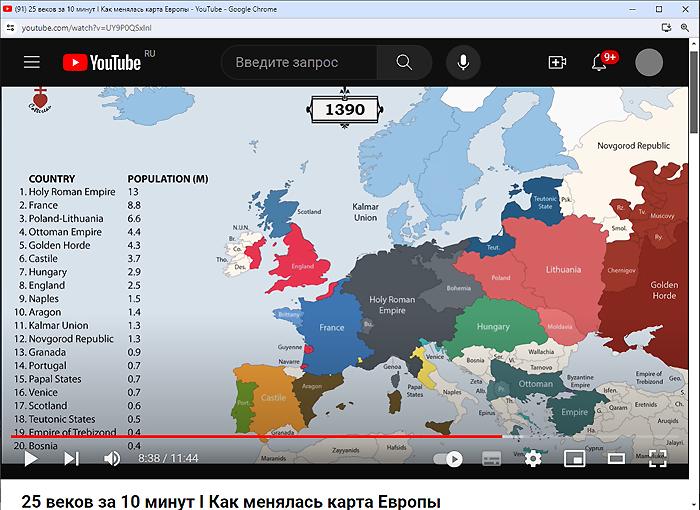
Fig. 4. Map of Europe in 1390 on various Internet projects: Video clip of the Cottereau channel. 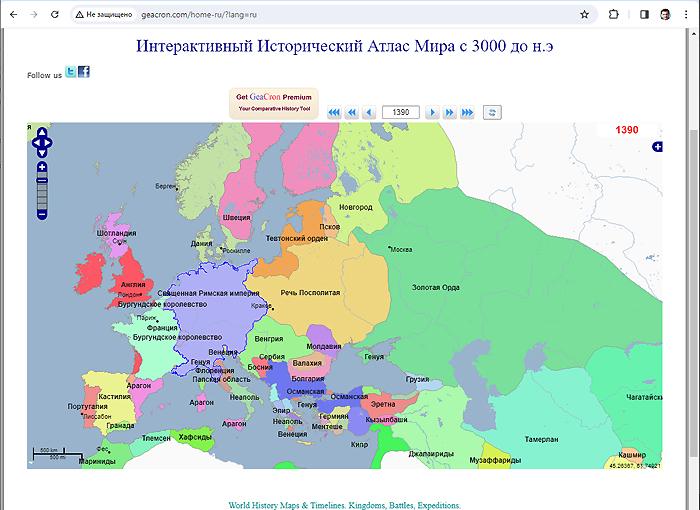
Fig. 5. Map of Europe in 1390 on various Internet projects: Interactive project "GeaCron". Figure 2-5 shows screenshots of the map of historical borders in Europe in various projects. All the cards convey the same moment, 1390 This year alone, there were many "gray areas" in the definition of the concept of states that can be painted over in one color, and all over Europe. Burgundy, the Holy Roman Empire, Scandinavia under the crown of Margrethe I, the Union of Kreva, the Russian principalities and their relations to the Golden Horde are all objects that require special approaches, but how to ensure them within the framework of one project? Let's not forget the second substantive question, about the sources of information about the drawing of borders over a thousand years. It seems so complicated that a multi-volume monograph could be written about it, and the fact that the submitted projects often show the same boundaries in different ways only testifies to the complexity of the issue. The question of the visual design of the maps also remains open, and the opportunity to compare different projects here is also very useful. Thus, the considered problem of historical boundaries reveals the difficulties of creating a GIS project in all their diversity, and the issue, unlike the rather abstract "history of battles", seems to be very necessary and in demand. It is no coincidence that there are several of these projects, and very time-consuming ones, and new ones appear periodically. There are many possible topics that you can pay attention to in this course, and only two examples from a number have been described above. I can draw attention to such exotic visualization examples as the image of the world's population density using three-dimensional columns (Human Terrain. Visualizing the World's population in 3D. Online project. URL: https://pudding.cool/2018/10/city_3d /) (Fig.6; everything is clear here with the object of the study, but the question of data sources is very serious), as an image of various statistics using the method of dynamically changing the size of countries with the formation of gaps between them (Bouncy Maps. Website. URL: https://www.bouncymaps.com /) or with distortion of their territories (Worldmapper. Website. URL: https://worldmapper.org /). For all of them, it seems to be very useful to use the above-described approach of classifying problems into substantive, source-based and visual ones. 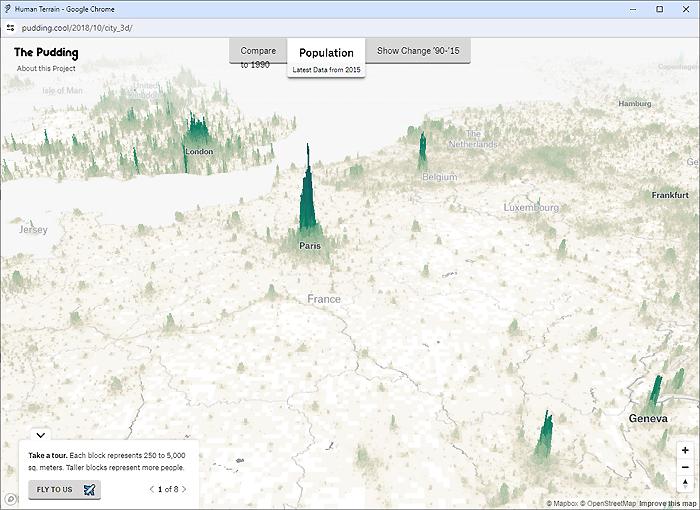
Fig. 6. A fragment of the Internet project "Human Terrain" depicting the density of the Earth's population in three-dimensional columns above the squares of the territory. The project (in the lower left corner of the frame) states that in populated areas the squares have an area of 250 square meters. meters. In fact, they only have a side equal to 200-250 meters.
The logical continuation of the conversation about meaningful problems in the information and entertainment field is the transition to the analysis of scientific historical works in which GIS is used. The scientific work is distinguished by the fact that the author most often gives his answers to questions about the meaningful purpose of using GIS and about the source study of the project. Therefore, when getting acquainted with the material, students need not just to consider spatial visualization, but to understand how meaningful problems are formulated by the authors. It's not always easy. Let's consider for example only one map from the work of V. N. Vladimirova on the settlement of Altai in the XVIII–XX centuries [5, pp. 104-191] The author, based on the state of the sources used, illustrates the process with maps of the emergence of settlements. Among others, there is a separate such map for the period 1906-1919. The main settlement of the region during this period obviously occurred during the years of the Stolypin reform, when a huge number of settlers came to the Urals in general, and to the southern part of the Tomsk province in particular. 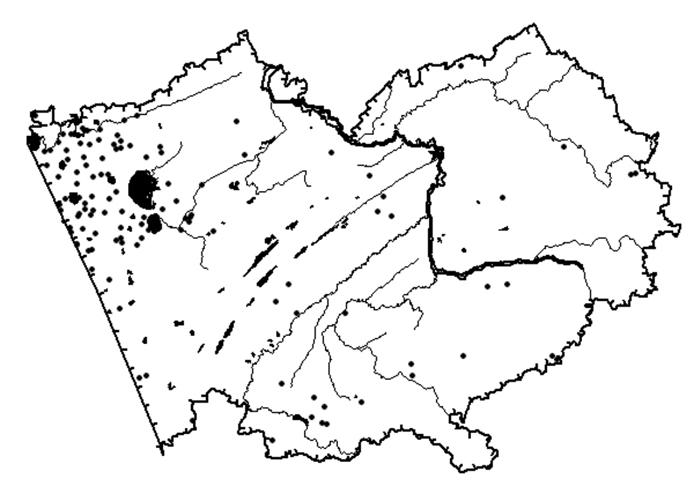
Fig. 7. Map of the formation of settlements in the Altai Territory in 1906-1919 [5, p. 184]. As can be seen on the map shown in Fig. 7, the largest number of points (new settlements) during this period was registered in the northwestern part of the modern Altai Territory. It should be borne in mind that the Kulunda steppe is located there, and the conditions for agricultural development of this territory were among the worst in the region. Nevertheless, the first impression is that during the Stolypin resettlement, for some reason, people settled mainly there. When discussing the text, this point of view is heard more often than others, rather, ideas about the causes of such a strange phenomenon vary. Meanwhile, and some students manage to notice this, on this map it is not so much what is on it that is important, as what is not on it. The figure shows the emergence of new settlements, but does not show the flows of migrants who settled in the old settlements. There were so many immigrants at that time that some of them (obviously, the overwhelming minority, although this is not visible from the data provided) even had to settle in a new, not very suitable territory for settlement, because all the more suitable ones had already been mastered by that time. The analysis of scientific papers and the GIS maps attached to them is especially important, because this is the only way to see more or less successful examples of meaningful use of GIS in historical research. The formation of the maps themselves, the development of the software is a technical stage, which, although not so simple, is just a mechanical study of the techniques embedded in the programs, and although this is also important, it seems less important than the described part of the course. There is not too much time left for learning to work in programs in our course, the classroom load remains more often 6, less often 8 hours, moreover, this time in the spring semester falls on May with holidays. Therefore, it is also inevitable that significant work will be transferred to an extracurricular workload. According to the agreements with the students, you can choose two models. In the first one, the tools for basic work with programs are shown in the classroom, and homework involves students completing tasks independently with answers to their questions in the last lesson. In the second model, lectures move into the extracurricular part, and students view recordings of classes taken earlier, and during classroom hours, on the contrary, perform tasks under the supervision of a teacher. Personally, I prefer the second option. With little time to work, mastering programs (in addition to general familiarity with the interface) affects only the three most basic tasks of creating GIS: · Drawing a shapefile based on a raster or based on an open Internet service (like OpenStreetMap); · attaching tabular data in MS Excel format to a ready-made digital map and creating thematic tables; · binding a raster map to a mathematical basis and reprojecting maps. (Here it is possible to give a task for binding using the "rubber sheet" method; binding raster maps to a coordinate grid in a known raster projection is easier, and there is not enough time for it.) Obviously, at the moment, the QGIS software environment is the most suitable for students of history to work with GIS: it is cross-platform, freely distributed, well compatible with Internet services, stores the result in the most common shapefile format, it is easy to find a lot of training materials on the Internet for working with tasks of different levels of complexity in QGIS. My experience, however, leads to the fact that it would be useful to familiarize students with the Google Earth software environment (Google.Earth), and in the form of a separate application, not a web environment (Google Earth. The installation page of a separate application on the general website of the Internet project. URL: https://earth.google.com/intl/earth/download/ge/agree.html). For example, if we need to find some objects (houses, settlements, bends of the road), then this can also be done on the basis of OSM enabled by the background layer in QGIS. However, on Google.Earth makes it faster and more convenient. When a set of objects is collected in Google.Earth, you can save the entire folder with them at once in a kml file (or kmz, this is the same, but the format is archived; kml is more convenient for perception, because, being a normal format of the xml family, it can be viewed and even edited as text with a set of tags). Then the kml file is simply opened in QGIS as a vector file, and all the points fall into their correct places, taking into account the current cartographic projection.
I will note another important feature of the Google program for a historian.Earth: it can serve as a good intermediary between QGIS and the open source project with raster historical maps "EtoMesto" (EtoMesto: Old maps of Russian cities online. Website. URL: http://www.etomesto.ru /). The latter is currently the best open electronic library of historical maps on the history of Russia (Russian Empire, USSR). In it you can find and download both large-scale and topographic maps, some historical satellite photographs, city plans, etc. The maps of the EtoMesto project are tied to a mathematical basis, and very qualitatively, even if they do not have a coordinate grid, but you cannot download them in GeoTIFF format. You can download either an unbound raster in jpeg format or a map fragment in kml format. The kml map is downloaded as a set of tiles, that is, small elements of a raster mosaic, which, if necessary, when the map is opened in the Google program.Earth, downloaded from the site "This Place". The important thing is that they open quite naturally on Google.Earth, but not in QGIS. If you need to make a vector map of some small fragment, it is convenient to do it on Google.Earth and then open the made objects in QGIS. Figure 8-9 shows the process of rendering in this way the railway section of the Trans–Siberian railway Irkutsk-Baikal, flooded in the 1950s by the waters of the Irkutsk reservoir. 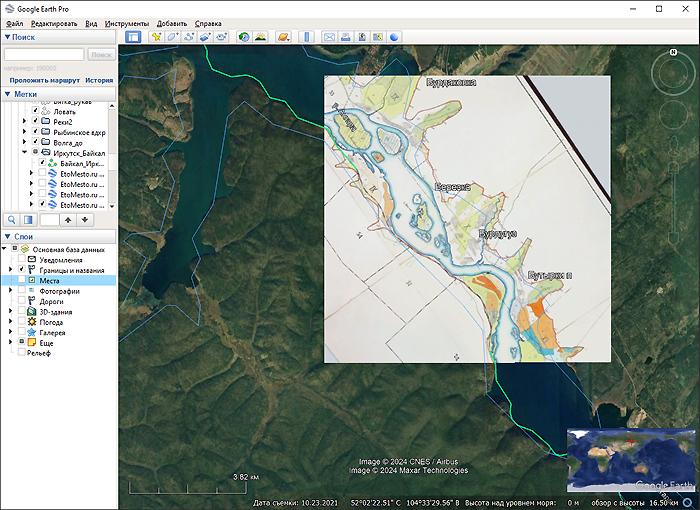
Fig. 8. Rendering (in green) of the map of the Trans–Siberian railway on the Irkutsk-Baikal section in the Google program.Earth based on a fragment of the 1953 map from the library "This Place" (such a fragment is downloaded in one kml file and consists of 256 tiles). A source: Map of Angara from Irkutsk to Lake Baikal in 1953 // This is the place: Old maps of Russian cities online. Website. URL: http://www.etomesto.ru/map-irkutsk_angara-1953 / 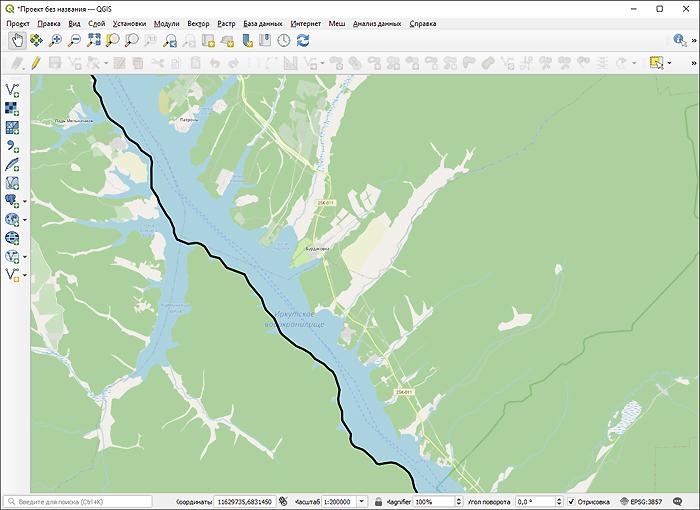
Fig. 9. The result of transferring the rendered section of the same map of the Trans-Siberian Railway (now in black) in the QGIS program. Undoubtedly, in conditions of more time to learn how to work with programs, it would be useful to consider other functions, but the practice of student work shows that there is usually enough ability to edit ready-made shapefiles, put the necessary objects on the map and make simple thematic tables. Over the past few years, the Department of Historical Informatics of the Faculty of History of Moscow State University has defended 11 graduate works of undergraduate and graduate students who used GIS (three are preparing for defense this year), and so far only these specified software functions have really been in demand by graduate students. However, this year the set of GIS functions used in graduation papers, judging by the way the process of their preparation is going on, will be expanded. Conclusion In conclusion, let's say that the assessment for the course "Historical Geography and GIS" consists of points assigned for completing eight tasks as you complete the course, three of them relate to working with software. The table shows the correspondence of the tasks performed by students to the main blocks of the course. | Course section | Tasks | | Historical geography | Report | | Cartography, map sources | No assignments; only lecture material | | GIS in historical research | Discussion:
1. Videos and so on.
2. scientific articles | | Working with the program (QGIS) |
1. Drawing a map
2. Binding the raster
3. Data connection, thematic map | As can be seen from the text, a certain problem of the course is a certain lack of academic hours. If you squeeze all the blocks into one semester course, then there is a maximum of a month left to work with software, and this is enough for initial familiarization with the basics of working in programs, but it would be possible to expand the course to a more detailed study of various program functions, for which there is no time left in today's schedule. In this regard, in the perspective of further development of educational courses specializing in Historical Informatics, it is worth expanding the course to two semesters.
References
1. Historical geography of Russia, 9th – early 20th cc.: Territory. Population. Economy: essays. (2013). Ya. E. Vodarsky, V. M. Kabuzan, F. V. Demkin et al. Moscow: Institute of Russian History, Russian Academy of Sciences.
2. Abramova, N. G., Kruglova, T. A. (2008). Historical geography of Russia. In Auxiliary historical disciplines: a university textbook (pp. 167-261). Moscow: Academia Press.
3. Drobizhev, V. Z., Koval'chenko, I. D., & Murav'ev, A. V. (1973). Historical geography of the USSR: a university textbook. Moscow.
4. Shul'gina, O. V. (2003). Historical geography of Russia in the 20th century: socio-political aspects. Moscow: Moscow Pedagogical State University.
5. Vladimirov, V. N. (2005). Historical geoinformatics: GIS in historical research. Barnaul: Altai State University.
Peer Review
Peer reviewers' evaluations remain confidential and are not disclosed to the public. Only external reviews, authorized for publication by the article's author(s), are made public. Typically, these final reviews are conducted after the manuscript's revision. Adhering to our double-blind review policy, the reviewer's identity is kept confidential.
The list of publisher reviewers can be found here.
The end of the XX - beginning of the XXI centuries was marked by the growth of interdisciplinary sciences, including in the framework of increased attention to social sciences and humanities. Among those areas that have become widespread in recent decades, it is impossible to ignore historical computer science. Indeed, at present, the possibilities of information technology allow us to reveal the images of past eras in a new way. In this regard, it seems important to turn to the study of the experience of teaching historical informatics in higher educational institutions of Russia. These circumstances determine the relevance of the article submitted for review, the subject of which is the experience of teaching the basics of historical geography and geoinformation systems at Moscow State University. The author sets out to reveal the curriculum of the discipline, analyze the work with students, and also show visualization examples used in the courses. The work is based on the principles of analysis and synthesis, reliability, objectivity, the methodological basis of the research is a systematic approach, which is based on the consideration of the object as an integral complex of interrelated elements. The scientific novelty of the article lies in the very formulation of the topic: the author seeks to characterize the experience of teaching the basics of historical geography and geoinformation systems at the Department of Historical Informatics of the Faculty of History of Moscow State University. Considering the bibliographic list of the article, its versatility should be noted as a positive point: although the list of references includes only 5 different sources and studies, nevertheless, within the framework of the study, they meet the tasks set by the author. Of the works used by the author, we will point to textbooks on historical informatics, as well as to the work of O.V. Shulgina, whose focus is on the socio-political aspects of the study of historical informatics. Note that the bibliography is important both from a scientific and educational point of view: after reading the text of the article, readers can turn to other materials on its topic. In general, in our opinion, the integrated use of various sources and research to a certain extent contributed to the solution of the tasks facing the author. The style of writing the article can be attributed to a scientific one, at the same time accessible to understanding not only to specialists, but also to a wide readership, to everyone who is interested in both historical informatics in general and issues of its teaching, in particular. The appeal to the opponents is presented at the level of the collected information received by the author during the work on the topic of the article. The structure of the work is characterized by a certain logic and consistency, it can be distinguished by an introduction, the main part, and conclusion. At the beginning, the author determines the relevance of the topic, shows that "it is impossible to talk about the historical geography of Russia in the XVIII–XX centuries without voicing a rather large amount of factual material (which there is no time for in the lecture mode); on the other hand, all this factual material is, in a certain sense, of a reference nature." The author draws attention to the fact that the topic of visualization is "the main one in the entire course, because in using GIS it is essential to understand what visualization depends on and what it shows; these answers are not always obvious." The paper shows that "at the moment, the QGIS software environment is the most suitable for students of history to work with GIS," however, the author believes that "it would be useful to familiarize students with the Google Earth software environment (Google.Earth)". The main conclusion of the article is that "a certain problem of the course is a certain lack of academic hours," while "in the perspective of further development of educational courses specializing in Historical Informatics, it is worth expanding the course to two semesters." The article submitted for review is devoted to an urgent topic, is provided with 8 figures and a table, will arouse readers' interest, and its materials can be used as part of the formation of courses in historical computer science. In general, in our opinion, the article can be recommended for publication in the journal "Historical Informatics".
|

 Eng
Eng


