|
Psychology and Psychotechnics
Reference:
Belinskiy A.V., Devishvili V.M., Chernorizov A.M., Lobin M.A.
Method of Ĺmotional State Assessment Using a Complex of Psychophysiological and Tensotremorometric Methods
// Psychology and Psychotechnics.
2023. ą 1.
P. 26-37.
DOI: 10.7256/2454-0722.2023.1.39849 EDN: FWJPOO URL: https://en.nbpublish.com/library_read_article.php?id=39849
Method of Ĺmotional State Assessment Using a Complex of Psychophysiological and Tensotremorometric Methods
Belinskiy Artem Viktorovich
ORCID: 0000-0001-5366-7018
Postgraduate student, Department of Psychophysiology, Lomonosov Moscow State University.
125009, Russia, Moscow region, Moscow, Mokhovaya str., 11 p.9

|
V10046321@yandex.ru
|
|
 |
Devishvili Vazha Mikhailovich
PhD in Biology
Associate Professor, Department of Psychophysiology, Lomonosov Moscow State University.
125009, Russia, Moscow region, Moscow, Mokhovaya str., 11 p.9
|
|
vmdev@mail.ru
|
|
 |
Chernorizov Aleksandr Mikhailovich
Doctor of Psychology
Head of the Department of Psychophysiology, Professor, Department of Psychophysiology, Lomonosov Moscow State University.
125009, Russia, Moscow region, Moscow, Mokhovaya str., 11 p. 9
|
|
amchern53@mail.ru
|
|
|
|
Lobin Mikhail Aleksandrovich
Senior developer, First Cargo Company DJITAL Limited Liability Company
105066, Russia, Moscow, Novoryazanskaya str., 24
|
|
m.lobin@list.ru
|
|
|
|
DOI: 10.7256/2454-0722.2023.1.39849
EDN: FWJPOO
Received:
24-02-2023
Published:
03-03-2023
Abstract:
The object of research is emotional tension. The subject of the study is assessment of emotional tension in the process of presentation of emotionally significant stimuli in the form of images and sounds according to the parameters of physiological activity and tensotremorometry in the process of maintaining isometric effort. Particular attention is paid to the consideration of methods of determination of tremor and its connection with emotional tension. Key aspects are the consideration of the key frequency range of physiological tremor analysis 8-16 hertz, methods of tremor measurement such as accelerometry, tensotremorometry, electromyography. Studies of the relationship between tensotremorometry on the frequency range of physiological tremor and emotional tension are considered. We propose a new method for analyzing tremor according to tensotremorometry data using the sliding window method and filtering the frequencies characteristic of physiological tremor. Methods of recording physiological activity in the form of photoplethysmography and skin electrical activity were used for reliability of the results obtained. We described and confirmed the connection between emotional tension during the demonstration of meaningful stimuli and finger tremor, while holding a given force in an isometric condition. The new technique has wide possibilities for use in the psychological and clinical fields, in particular, in detection of hidden information, assessment of the stress resistance of personnel, and determination of the functional state of a person, as well as in the study of the psycho-emotional state of students.
Keywords:
Involuntary movements, Autonomic nervous system, Physiological tremor, Maximum voluntary contraction, Tensotremorometry, Emotional tension, Isometric force, Psychophysiology, Epps-Singleton criterion, Neurokit2
This article is automatically translated.
You can find original text of the article here.
IntroductionTremorography as a way of assessing the psychoemotional state of a person has been well studied and used in psychophysiology for a long time [2, 3, 8]. It is used both to assess pathological conditions (for example, Parkinson's disease, and essential tremor) [14, 15, 20] and to assess the conditions of a healthy person. It is known that a tremor consists of several components that manifest at different frequencies, each of which is generated by its own source. This article examines the psychoemotional tension of healthy subjects, which is characterized by changes in physiological tremor at frequencies in the range of 8-16 Hz [1, 4, 21, 24] The main instrumental methods of tremor research are accelerometry, electromyography and tensotremorometry, which use fundamentally different approaches to data collection - for example, accelerometry relies on measuring the acceleration of fingers in the air, while tensotremorometry uses a support on which fingers are placed, and the force of pressing on this support is removed, and electromyography directly examines muscle activity, creating this tremor. Each of these methods has its own characteristic features that determine its use in a particular situation, however, in this article the main objectives of the study are to study the fundamental possibility of using tensotremorometry as an indicator of the severity of emotional stress, as well as to develop a methodology for assessing the strength of emotional stress with its help. Such studies were conducted from the point of view of assessing the pathological condition of a person, as well as age-related changes in the nature of tremor and the strength of the reaction to emotionally significant stimuli. Thus, when studying the tremor of the articular angle using a strain gauge as an indicator of the psychophysiological state, significant differences in the amplitude distribution in the frequency band of 7-11 Hz and 1-3 Hz, with electric shock, physical exertion and cognitive load, in contrast to the norm, were revealed [3]. E.A. Kristou and colleagues have convincingly shown that an increase in tremor power in the ranges of 0-2 Hz increases in all age categories, especially in the group of elderly subjects when an emotionally significant stimulus in the form of an electric shock is presented in the process of maintaining a given effort of 2% of the maximum arbitrary reduction. In this work, the response to the stimulus was verified by physiological indicators. As a result, there were differences in the tremor amplitude at the frequencies set by the researchers [9, 10] The last study that used a similar design was conducted by R.L. Blackmore together with colleagues. The sample consisted of 18 healthy subjects and 18 subjects with Parkinson's disease. The task was to maintain the target force value, which was marked with a line and was equal to 15% of the maximum arbitrary reduction for 12 seconds. At a random moment of the last 6 seconds, an image from the International affective picture system (IAPS) database was presented[16]. There was no physiological confirmation of emotional significance. The results showed that it was not possible to detect significant differences in the increase in tremor power in the ranges of 0-4 Hz, 4-8 Hz and 9-12 Hz in healthy subjects. However, in people with Parkinson's disease, a significant difference was found in the ranges of 0-4 Hz and 4-8 Hz in the direction of increase [6] In this paper, the task was to assess the possibility of studying the reaction to an emotionally significant stimulus. The proven COMPASS database [23] and sound stimuli were used as emotionally significant stimuli. Physiological control of the significance of the stimulus was carried out with the help of indicators of the VNS – photoplethysmogram (FPG) and electrical activity of the skin (EAC). For more accurate collection and analysis of tensotremorography data, a specially developed device based on force-sensitive sensors not previously used in this direction, and a mathematical analysis technique based on data fragmentation by the "sliding window" method and further comparison of recording fragments with a control recording of tremor at rest using the Epps-Singleton criterion were used[11] Thus, the novelty of the study lies in the use of a database of stimuli of emotionally significant images and sounds, combined with more accurate sensors and a previously unused mathematical method of analysis. The aim of the study is to create a methodology for assessing the level of emotional tension using strain gauges that register nonlinear changes in resistance and registration of physiological indicators in the process of presenting emotionally significant stimuli. The hypothesis of the study is that the amplitude characteristics of a tensotremorogram at a frequency of 8-16 Hz, in an isometric condition, when emotionally significant stimuli are presented, will differ from the same characteristics in control conditions. The objectives of the study included testing the possibility of using tensotremorography to study stress with additional verification using the methods studied, and developing an assessment methodology based on the results obtained. Research programExperimental procedure, method and methodology The study involved 50 people (28 men and 22 women, average age = 23 +/- 2,4 year).
The subjects were instructed to clamp a load cell between the index finger and thumb, with a solid support on the reverse side of which. This is done to eliminate artifacts associated with the bending of the sensor. The subject was in a sitting position, the hand rested on the table with the forearm and hand, the palm was located on the side of the little finger "palm edge" (Fig. 1). In front of the subjects at a distance of 30 cm from the eyes there was a feedback monitor (Fig. 2). 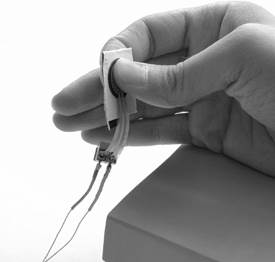
Fig. 1. Retention of a given force in an isometric condition Measuring the maximum arbitrary reductionThe maximum arbitrary reduction (MPS) is understood as the maximum force applied, and is used to normalize the strength characteristics of the subjects. The subject was instructed to compress the load cell as much as possible for 6 seconds. The average value of the ten largest force samples for each sensor in each of the three tests gave an estimate of the MPS of the subjects. The procedure for studying the maximum arbitrary contraction is carried out according to the method for experiments on the study of the feedback of force contraction in Parkinson's disease [22]. Incentive materialAs a stimulus material, 15 images were selected from the COMPASS database [23], divided by valence categories into negative (images that cause disgust), positive (beautiful images) and neutral, 5 sound stimuli from the database, including the sounds of an explosion, male and female screams lasting 1 s. at a volume of 105 Db, as well as 5 sound stimuli containing silence. All stimuli were randomly distributed according to the time of presentation in the interval from 5 to 20 seconds, as well as according to the order of presentation and were presented within 2 seconds. Instructions and procedureAt each stage, the subject was offered the following instruction: “ You need to maintain the specified target effort level (10000), shown by the horizontal line on the graph (Fig.2), for 30 seconds. At a random moment in time, you may be presented with an incentive in the form of an image or sound. Try to maintain the set level throughout the test.” Before the main session of experiments, the subjects had the opportunity to practice holding the line, passing a test of the same duration without a stimulus. The rest between stimuli was 5 seconds. 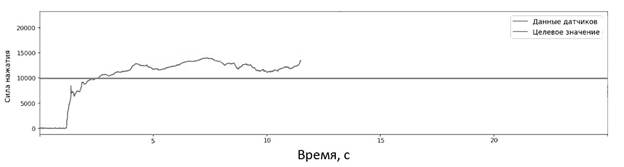
Fig. 2. Graph of the feedback of the power characteristics used by the subject. On the vertical axis - the force of pressing. On the horizontal axis – time within 30 seconds. Also, photoplethysmography and EAC data were used to verify the presence of emotional stress by other methods. Physiological data were obtained using the open source program Neurokit 2 [17] The tensotremorography data obtained as a result of the experiment were processed by the sliding window method [12] and filtered by a Butterworth bandpass filter at frequencies of 8-16 Hz, and then the recording sections were statistically compared with the recording at rest using the Epps-Singleton criterion, chosen for the reasons that it most accurately compares signals of different lengths. The purpose of the experiment and the task of the analysis was to search for significant differences between the recording sections when submitting stimulus material, and without it. ResultsRetention of a given force in an isometric condition These measurements were carried out to test the possibility of using tremor in an isometric condition as an indicator of emotional tension. 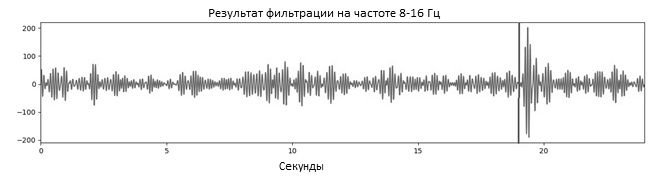
Fig. 4 - Tensotremorography in an isometric condition. The stimulus "Disgusting image" is presented at 18.5 seconds and marked with a vertical line. The result of filtering at a frequency of 8-16 Hz, the vertical axis is % MPSHz, the horizontal axis is time. The tremorogram in Fig. 4 shows a characteristic peak after filtering by the Butterworth filter at the moment of the signal (18.5 s), reflecting a characteristic increase in the tremor amplitude when emotional tension appears. The amplitude of this peak is several times higher than the amplitudes of other extremes. Similar results of tremorography suggest the presence of a pronounced reaction to an increase in emotional tension.
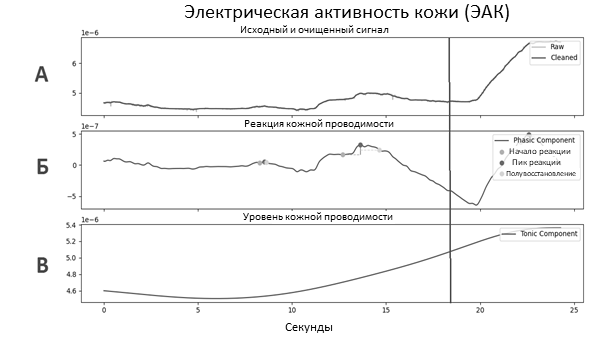
Fig. 5 – Electrical activity of the skin. The stimulus "Disgusting image" is presented at 18.5 seconds and marked with a vertical line. A – filtered EAC signal, along the vertical axis - skin conductivity, in MSM; B – Phase component of Electro-dermal conductivity, in tenths of MSM; C - tone component of Electro-dermal conductivity along the vertical axis, in MSM. On the horizontal axis of all three graphs, the time is in seconds. As can be seen in Fig. 5, measurements of the skin conductivity of the subject, carried out in parallel with tensotremorography, also show a characteristic reaction on Graph B, coinciding with the reaction delay (1.5-6 seconds) with the moment of the stimulus [13] A similar situation can be observed in Fig. 6, where graphs of the corresponding photoplethysmogram are shown, with highlighted peaks. The graph shows a rapid increase in the subject's heart rate after the moment of submission of the stimulus material, which also indicates excitement and emotional reaction of the body. 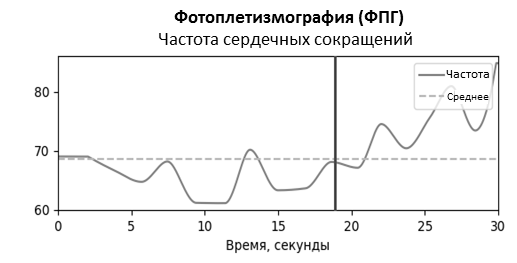
Fig. 6 – Photoplethysmogram, the stimulus "Disgusting image" is presented for 18.5 seconds, and marked with a vertical line. The graph shows the heart rate (HR), along the vertical axis - the number of heartbeats per minute. On the horizontal axis of the graph is time. Table 1. Statistical Epps-Singleton test* of tensotremorogram data.Incentive material was presented | | | Incentive material was not presented | | Type of incentive | Epps-Singleton | p-value | dmax, % MPC | Epps-Singleton | p-value | dmax, % MPC | | Sound | 38,205425 | 0,000367 | 8,28 | 24,176078 |
0,001503 | 2,23 | | Beautiful | 35,089456 | 0,000169 | 7,75 | | Disgusting | 41,284891 | 0,000266 | 7,42 | | Neutral | 25,761851 | 0,000935 | 3,39 | *Test statistics are significant in each case (p-value < 0.05)Table 1 shows the results of statistical analysis (Epps-Singleton statistics, p-value for this statistic, as well as the difference between the minimum and maximum amplitude on the record, dmax). Here, a greater value of the Epps-Singleton statistics corresponds to a greater difference between the recording area after the stimulus and the recording before the stimulus (Fig.4), a greater value of dmax corresponds to a greater difference in amplitudes on the recording according to the totality of data from all subjects. Based on the results of statistical analysis, it can be concluded that there is a significant increase in the degree of difference of the site after the submission of stimulus material between recordings with stimuli such as "Sound", "Beautiful image", "Disgusting image", and recordings with a stimulus "neutral image" or with an empty audio file as a stimulus, as well as the presence of a significant increase in the difference the minimum and maximum tremor amplitude dmax (approximately 2.5-3 times) between the same recordings. Here dmax is used as an indicator of the strength of the response to an emotional stimulus. This allows us to conclude that the tremor change occurs simultaneously with changes in the FPG and EAC data characteristic of emotional stress. The statistical analysis data confirm the assumptions based on indicative graphs, as well as the main hypothesis of the experiment about the presence of a connection between the emotional stress of the subject, determined by the EAC and FPG data, and a significant change in the tensotremorogram. 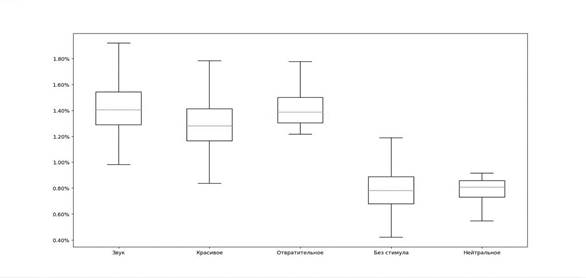
Fig. 7 Diagram of the percent span of the maximum arbitrary reduction (MPS) depending on the stimuli presented in the conditions of isometric effort. On the vertical axis - % MPS. Figure 7 shows a graph of the spread of the difference between the maximum amplitude without a stimulus and the maximum amplitude when different stimuli are applied. It can be noticed that the spread increases significantly when a stimulus is applied that causes emotional tension, and remains relatively small when an empty audio file or a neutral image is applied as a stimulus material. Here, the sample average +/- standard deviation is in the range from 1.3% to 1.5% when the stimulus “Sound” is applied, the interval is 1.2% - 1.4% when the stimulus “Beautiful Image” is applied, and the interval is 1.3% - 1.4% when the stimulus “Disgusting image” is applied, despite the fact that the average values for experiments without a stimulus or with a neutral stimulus, they are in the range of 0.8% - 1%. This difference in the variation of amplitudes is significant, and indicates the presence of an increase in muscle tone when presented with a stimulus. The median values in the graphs with the presented stimulus have similar values, which indicates a non-specific reaction with respect to the stimulus. Thus, it can be said that the demonstration of a stimulus that causes a stress reaction also causes significant changes in tensotremorography under conditions of holding a single sensor with a pinch grip. DiscussionThe choice of the methodology for the study of tremor and psychophysiological parameters is determined by the short duration of a significant reaction to emotional stress. Based on this, the analysis methodology uses fragmentation by the "sliding window" method, since in order to determine the moment of reaction to a stimulus, it is necessary to divide the recording into sections, however, when separating without overlapping, there is a possibility that the moment of reaction will be divided between two fragments and will not be processed correctly. Also, the Epps-Singleton criterion was chosen for analysis because of the highest accuracy when comparing records of different lengths. The main attention in the work is paid to the analysis of tensotremometry data at frequencies characteristic of physiological tremor, excluding frequencies characteristic of pathological and other types of tremor, and the correlation of these data with synchronously collected data from sensors of physiological reactions of the subjects. Most researchers, studying tremor and its changes by various methods, rely on the data of pathological tremor obtained when studying the consequences of Parkinson's disease. Another alternative to this approach is the study of physiological tremor using accelerometry [8], current-vortex sensors [5], or strain gauges [19]. The experiment was carried out according to the scheme with the sensor held in a stationary hand, and using a proven database of stimuli as a method of evoking emotional tension. The main difference from other works in the experiment was the method of analysis, since the data of the physiological state of the subject and tremorometry were simultaneously studied. In addition, filtering the necessary frequencies and fragmentation of the final data became an important part of the analysis. In a similar experiment with maintaining a given effort in an isometric condition, stimulation was carried out using the IAPS database of emotional images and data obtained from maintaining a given effort of 2% of MPS. Based on the results of the study, the authors concluded that exposure to pleasant and unpleasant images led to a relative increase in force production, but did not change the variability of force production compared to the conditions in which participants viewed neutral images [18] In a study where electric shock was chosen as stimulation, it was shown that muscle contraction in an isometric condition leads to an increase in the variability of force production at a low level of MPS [10] The discrepancy between the results obtained was obtained in comparison with the study by R.L. Blackmore and colleagues, in which no significant differences were obtained in a group of healthy subjects in the range of physiological tremor. This may be a consequence of a small sample of healthy subjects [7]. Our experimental results partially agree with those obtained earlier by researchers with different variants of stimulus material. For example, the sound stimulus, having a larger spread, as in the experiment with electric shock [9, 10], may have had greater significance for the subjects. As a result of the experiment, an increase in the amplitude of tremor in a state of emotional tension was shown, however, the scale of such an increase was extremely heterogeneous for different subjects, creating a significant discrepancy between the 10th and 90th percentile of amplitudes. The reason for this discrepancy is not entirely clear, and definitely needs further investigation, since this increase is observed steadily, however, the ratio of the standard deviation from the average amplitude remains close to one. The differences in the nature of such changes in the presentation of stimuli of different nature (sound and visual), as well as different emotional valence, are investigated, and differences are demonstrated The proposed technique has wide possibilities of refinement for practical use, in particular, for the purpose of instrumental detection of hidden information as markers of emotional tension. The technique can also find its application in clinical studies, as well as in the study of age-related changes in the human motor system. An important direction of using the methodology can be the study of the psycho-emotional state of students, both directly at the moment of learning and over a long period of time. In the future, the data obtained can be used to correct curricula, teaching methods and educational programs in order to ensure the best assimilation of the material by students.
ConclusionThis technique allows you to use the characteristics of tensotremorometry in the process of detecting emotional stress. There are wide possibilities of using as a clinical method for determining diseases of the nervous system that are associated with tremor. This method complements the existing knowledge about the connection between the psychophysiology of movement and emotions. In the future, it seems interesting to deepen the study of the prerequisites and causes of an increase in the level of psycho-emotional tension. So, one of the possible directions of further research is to study using EEG and fMRI methods the mechanisms of brain work with an increase in the level of psycho–emotional tension. On the other hand, it is important to study the features of the manifestation of psycho-emotional stress due to age and the presence of psychiatric and psychophysiological diseases, since tensotremorographic methods in these cases may be less accurate. This is due to additional sources of tremor, which can introduce noise into the studied signal and, without correction, taking into account the specifics of the studied, create the ground for incorrect interpretation of the data obtained.
References
1. Aleksandrov A.Y., Uplisova K.O., Stepanov A.V. & Ivanova V.Y. (2017). concealed information dependent emotional reactions assessment based on physiological tremor and peripheral hemodynamics acquisition In Materials of the XXIII Congress of the Physiological Society named after I.P. Pavlova with international participation (pp. 1189-1191).
2. Gurfinkel, V. S., Kocz, Ya. M., & Shik, M. L. (1965). Regulation of human posture. Academy of Sciences of the USSR. Institute of Biol. physics. Publisher Nauka. Moscow.
3. Devishvili V.M., Mirzad M.A., Romanyuta V.G., & Sudakova N.L. (1974) Tremor as an indicator of the psychophysiological state of the operator. In: Ergonomics.Tr.VNII Technical aesthetics,Vol.6, pp. 107-124
4. Dik O. E., Nozdrachev A. D. (2019) Mechanisms of changes in dynamical complexity of physiological signal patterns. St. Petersburg: Publishing House of St. Petersburg University. P.200. doi:10.21638/11701/9785288059322
5. Eskov, V. M., Zinchenko, Yu. P., Filatov, M. A., & Ilyashenko, L. K. (2017). Glansdorff-prigogine theorem in the description of tremor chaotic dynamics in cold stress. Human ecology, (5), 27-32. doi:10.33396/1728-0869-2017-5-27-32
6. Blakemore, R. L., Rieger, S. W., & Vuilleumier, P. (2016). Negative emotions facilitate isometric force through activation of prefrontal cortex and periaqueductal gray. Neuroimage, 124, 627-640. doi:10.1016/j.neuroimage.2015.09.029
7. Blakemore, R. L., Shoorangiz, R., & Anderson, T. J. (2018). Stress-evoking emotional stimuli exaggerate deficits in motor function in Parkinson's disease. Neuropsychologia, 112, 66-76. doi:10.1016/j.neuropsychologia.2018.03.006
8. Carignan, B., Daneault, J. F., & Duval, C. (2012). The organization of upper limb physiological tremor. European journal of applied physiology, 112, 1269-1284. doi:10.1007/s00421-011-2080-3
9. Christou, E. A., Jakobi, J. M., Critchlow, A., Fleshner, M., & Enoka, R. M. (2004). The 1-to 2-Hz oscillations in muscle force are exacerbated by stress, especially in older adults. Journal of applied physiology, 97(1), 225-235. doi:10.1152/japplphysiol.00066.2004
10. Christou, E. A. (2005). Visual feedback attenuates force fluctuations induced by a stressor. Medicine & Science in Sports & Exercise, 37(12), 2126-2133. doi:10.1249/01.mss.0000178103.72988.cd
11. Epps, T. W., & Singleton, K. J. (1986). An omnibus test for the two-sample problem using the empirical characteristic function. Journal of Statistical Computation and Simulation, 26(3-4), 177-203. doi:10.1080/00949658608810963
12. Fumarola, F., Ciampi, A., Appice, A., & Malerba, D. (2009, October). A Sliding Window Algorithm for Relational Frequent Patterns Mining from Data Streams. In Discovery Science (pp. 385-392). doi:10.1007/978-3-642-04747-3_30
13. Giannakakis, G., Grigoriadis, D., Giannakaki, K., Simantiraki, O., Roniotis, A., & Tsiknakis, M. (2019). Review on psychological stress detection using biosignals. IEEE Transactions on Affective Computing, 13(1), 440-460. doi:10.1109/TAFFC.2019.2927337.
14. Grimaldi, G., & Manto, M. (Eds.). (2012). Mechanisms and emerging therapies in tremor disorders. Springer Science & Business Media.
15. Jankovic, J., & Lang, A. E. (2021). Diagnosis and assessment of Parkinson disease and other movement disorders. Bradley’s Neurology in Clinical Practice E-Book, 310(1).
16. Lang, P. J., Bradley, M. M., & Cuthbert, B. N. (1997). International affective picture system (IAPS): Technical manual and affective ratings. NIMH Center for the Study of Emotion and Attention, 1(39-58), 3.
17. Makowski, D., Pham, T., Lau, Z. J., Brammer, J. C., Lespinasse, F., Pham, H., ... & Chen, S. A. (2021). NeuroKit2: A Python toolbox for neurophysiological signal processing. Behavior research methods, 1-8. doi:10.3758/s13428-020-01516-y
18. Naugle, K. M., Coombes, S. A., Cauraugh, J. H., & Janelle, C. M. (2012). Influence of emotion on the control of low-level force production. Research Quarterly for Exercise and Sport, 83(2), 353-358. doi:10.1080/02701367.2012.10599867
19. Novak, T., & Newell, K. M. (2017). Physiological tremor (8–12 Hz component) in isometric force control. Neuroscience Letters, 641, 87-93. doi:10.1016/j.neulet.2017.01.034
20. Shiderova, G. B., Karimova, A. S., Kaishibayeva, G. S., & T Amrayeva, G. (2021). Essential tremor not just a tremor. Medicine, 223(1), 39-43. doi:10.31082/1728-452X-2021-223-1-39-43
21. Vaillancourt, D. E., & Newell, K. M. (2000). Amplitude changes in the 8–12, 20–25, and 40 Hz oscillations in finger tremor. Clinical neurophysiology, 111(10), 1792-1801. doi:10.1016/S1388-2457(00)00378-3
22. Vaillancourt, D. E., Slifkin, A. B., & Newell, K. M. (2001). Visual control of isometric force in Parkinson's disease. Neuropsychologia, 39(13), 1410-1418. doi:10.1016/S0028-3932(01)00061-6
23. Weierich, M. R., Kleshchova, O., Rieder, J. K., & Reilly, D. M. (2019). The complex affective scene set (COMPASS): Solving the social content problem in affective visual stimulus sets. Collabra: Psychology, 5(1). doi:10.1525/collabra.256
24. Young, I. C. (1933). A study of tremor in normal subjects. Journal of Experimental Psychology, 16(5), 644. doi:10.1037/h0071165
Peer Review
Peer reviewers' evaluations remain confidential and are not disclosed to the public. Only external reviews, authorized for publication by the article's author(s), are made public. Typically, these final reviews are conducted after the manuscript's revision. Adhering to our double-blind review policy, the reviewer's identity is kept confidential.
The list of publisher reviewers can be found here.
The paper "A method for assessing the emotional state using a complex of psychophysiological and tensotremorometric methods" is presented for review. The subject of the study. The subject of the study is not indicated in the work. Based on the title, it can be noted that the subject corresponds to the content of the scientific work. In the article, the subject is disclosed in accordance with the set goal, objectives and hypothesis. Research methodology. The task of the peer-reviewed work was to evaluate the possibility of studying reactions to an emotionally significant stimulus. The proven COMPASS database and sound stimuli were used as emotionally significant stimuli. The physiological control of the significance of the stimulus was carried out using indicators of the VNC photoplethysmogram (FPG) and electrical activity of the skin (EAC). For more accurate collection and analysis of tensoremorography data, a specially developed device based on force-sensitive sensors not previously used in this direction, and a mathematical analysis technique based on data fragmentation by the "sliding window" method and further comparison of recording fragments with a control recording of tremor at rest using the Epps-Singleton criterion were used. The relevance of the study is beyond doubt. The author substantiates the relevance both from the understanding of the scarcity of theoretical and practical research, and from the position of the need to assess the emotional state of a person. However, it is necessary to use special methods and techniques for this. The scientific novelty in the work is indicated. The author notes that the novelty of the study lies in the use of a database of stimuli of emotionally significant images and sounds, combined with more accurate sensors and a previously unused mathematical method of analysis. Style, structure, content. The style of presentation corresponds to publications of this level. The language of the work is scientific. The structure of the work is clearly visible. The introduction provides a description of the relevance and a small theoretical overview, highlights the purpose and hypothesis of the study. The next section describes the research program, experimental procedures, method and methodology. The results are described below. In conclusion, a detailed discussion of the results is conducted, and a brief conclusion is presented. Bibliography. The bibliography of the article includes 24 domestic and foreign sources, a small part of which has been published in the last three years. The list includes not only research articles, monographs, but also dissertations. The sources of information are mostly designed correctly, but some are not designed in accordance with the requirements. It is possible to identify certain inaccuracies that need to be improved. Appeal to opponents. The goals and objectives set by the author have been implemented. However, special attention should be paid to the analysis of the text in order to highlight spelling and syntactic descriptions and errors. Conclusions. The problems of the article are of undoubted relevance, theoretical and practical value, and will be of interest to researchers. The work may be recommended for publication.
|

 Eng
Eng


