|
DOI: 10.7256/2454-065X.2022.1.37468
Received:
03-02-2022
Published:
15-03-2022
Abstract:
The investment resources of the population in Russia have a high potential from the standpoint of ensuring sustainable economic growth. Stimulation of investment activity of the population occurs with the help of various instruments, among which tax incentives have a significant place. The implementation of tax instruments to stimulate investment activity of the population should be carried out taking into account both tax and monetary, as well as social effects, since the economic spiral of such incentives leads not only to an increase in the growth rates and incomes of investors, but also affects the monetary inequality of citizens. The subject of the study is the socio-economic relations between the state and taxpayers regarding tax incentives for investment activity of citizens and the effects of this incentive. Â The study assessed the tax, monetary and social effects of the current system of tax incentives for investment activity of citizens. It is proved that the investment potential of citizens in the Russian economy is realized rather poorly. Tax incentives are one of the instruments of state stimulation of investment activity of citizens. The personal income tax investment deduction in the amount of funds deposited to an individual investment account is one of such instruments. The shortcomings of the regulation of individual investment accounts in Russia are revealed both from the standpoint of the incentive mechanism itself and the impact of tax deduction on the monetary inequality of citizens. Proposals have been formed to eliminate shortcomings.
Keywords:
Investment, investment activity of citizens, individual investment account, tax deduction, monetary inequality, tax benefits, tax incentives, income tax, effect, households
This article is automatically translated.
You can find original text of the article here.
Introduction In modern conditions, the population is not only a consumer of society. The household sector performs socio-economic functions, in particular - investment-savings feature, which is one of the key terms of economic development. First, the size of the savings is one of the indicators of standard of living in the country. Savings have a clear social orientation, "stabilize" the household: they are formed with the aim of providing opportunities for children with a quality education, maintaining a comfortable level of consumption in retirement, the formation of a "safety cushion" in case of emergencies etc. secondly, savings serve as a resource factor in ensuring economic growth, restructuring and improvement of the economy: this is possible with the involvement of the resources of households in the reproductive process is the creation or development of business and investment projects [1, p. 96]. It should be noted that this function do exactly formal savings of the population that are classified as investments. Implementation of the investment potential of the Russian population In the structure of investment resources of Russia, the household sector has a high share (figure 1). However, during the period 2015-2019. it decreased by 18.6 p. p.: with 33,0% to 18.4%. The share of investment resources of the household sector has been relatively stable in the 2015-2017 period, and declined sharply in 2018-2019. 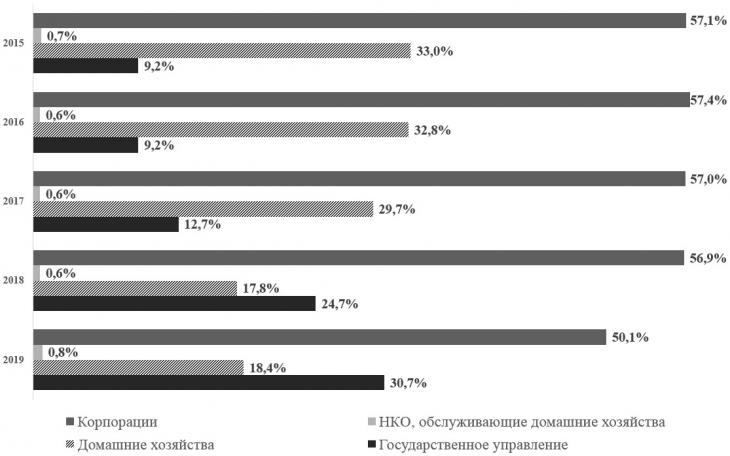
Figure 1 - Structure of investment resources for institutional sectors according to Rosstat, in 2015-2019. Compiled by the authors: [2, c. 16],[3, c.16] This dynamics is determined by a combination of factors, the key of which is an absence of significant positive dynamics of changes in real incomes (table 1). Despite the steady growth of per capita income, real disposable income in the 2015-2017 period tended to decrease, and in 2018-2019, did not grow as much in order that the public has the opportunity to transform them into investment resources. In fact, the savings of the household sector, which can potentially be considered investment resources represent a positive balance between income and funds aimed at current consumption. In recent years, the situation encourages people to apply to credit institutions to borrow funds to cover current expenses – in these conditions the size of savings and investment in particular does not increase. [4] Table 1 – Dynamics of population incomes in 2015-2019. | Figure incomes | Year | | 2015 | 2016 | 2017 | 2018 | 2019 | | The average income of the population (in % to previous year) | 111,2 |
102,0 | 103,3 | 104,3 | 106,2 | | Real disposable money incomes of the population (in % to previous year) | 97,62 | 95,5 | 99,5 | 100,4 | 101,0 | Compiled by the authors at: [5] The validity of this thesis can be traced when considering the indicators of the structure and dynamics of monetary costs and savings of the population (table 2). It can be seen that in Russia from year to year, the share of spending on goods and services, as well as mandatory payments that are classified as current consumption. The cost of acquisition of real estate has consistently decreased, but in 2018 showed strong growth, after which the figure stopped just short of the achieved levels. With regard to the incidence of the cost of acquisition of financial assets, it should be noted that during 2015-2019, they just fell to share of this expenditure has dropped from 15.2% in 2015 to 1.5% in 2019, these figures indicate that the population is experiencing difficulties in terms of availability of free resources for investment operations, which is a serious barrier to increase the investment activity. Table 2 – structure and dynamics of the monetary costs and savings of the population in 2015-2019. | Cash costs and savings | Year | | 2015 | 2016
| 2017 | 2018 | 2019 | | Total (billion rubles), including: | 53 526 | 54 118 | 56 205 | 58 459 | 62 076 | | the purchase of goods and services | RUB bn | 38 003 | 39 530 | 44 455 | 47 186 | 50 142 |
| share of expenses, % | 71.0 per | 77,5 | 79,1 | 80,7 | 80,8 | | growth rate (chain) | - | 4,0% | 12,5% | 6,1% | 6,3% | | mandatory fees and varied contributions | RUB bn | 5 815 | 6 066 | 7 937 |
8 801 | 9 522 | | share of expenses, % | 10,9 | 13,8 | 14,1 | 15,1 | 15,3 | | growth rate (chain) | - |
| |

 Eng
Eng